Common Myna
Acridotheres tristis
ABR description
The following is extracted from the Annual Bird Report for the twelve months to June 2017.
Very common, breeding resident
An exotic species subject to ongoing attempts at population control.
General: 8227 individuals were counted, up from 7972 last year. 2292 records, down from 2311 last year, from 65 grids similar to 66 grids last year. 27 WOO records up on 19 last year. Abundance is down 15% on last year, up 13% on the 10YA and up 41% on the 30YA. The reporting rate is down 18% on last year, down 5% on the 10YA but up 16% on the 30YA. Max 75/16 Apr Florey (KiB1); mean 3.6, median 2. Observed throughout the year with most observations in spring 29% and summer 37%. 122 breeding records up on 29 last year: earliest, on/9 Aug Fadden GrK16 (CaR3); latest, dy/8 Mar Page (KiB1).
GBS: 4190 individual birds reported, up from 3719 last year. 1024 records, up on 1013 records last year from 20 grids, up from 18 last year, and from 44 sites down from 48 sites last year. Abundance is up 28% on last year, down 7% on the 10YA and down 41% on the 30YA. Average number of birds 4.1, median 2 and max 70/3wk Mar Lyneham (LeM1). Records spread evenly throughout the year, with slightly more in summer (27%). 17 breeding records down from 25 last year: earliest, cf/1wk Sep Ainslie (HaS1); latest dy/2wk Feb Ainslie (HaS1).

Abundance
Abundance is the average number of birds of that species per survey. Where the species was observed (presence recorded) but the number of birds seen was not recorded, this is treated as a count of zero.
Abundance by year
This chart shows the abundance of Common Myna between 1982 and 2017. 
Abundance by month
This chart shows the monthly abundance of Common Myna. The blue lines show the abundance for the twelve months to June 2017 and the bars show the average abundance for the period 1982 to 2017. 
Abundance by season
This chart shows the seasonal abundance of Common Myna. The blue lines show the seasonal abundance for the twelve months to June 2017 and the bars show the average seasonal abundance for the period 1982 to 2017. 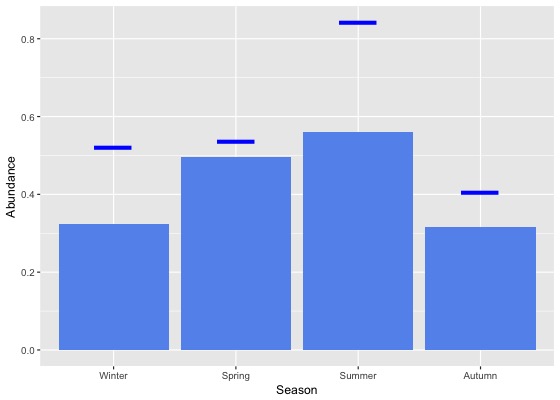
Abundance data
| Month | Season | ||||||||||||||||||
|---|---|---|---|---|---|---|---|---|---|---|---|---|---|---|---|---|---|---|---|
| Period | Jul | Aug | Sep | Oct | Nov | Dec | Jan | Feb | Mar | Apr | May | Jun | Winter | Spring | Summer | Autumn | All | ||
| All years | |||||||||||||||||||
| All | 0.3 | 0.4 | 0.3 | 0.7 | 0.4 | 0.5 | 0.6 | 0.7 | 0.4 | 0.3 | 0.3 | 0.3 | 0.3 | 0.5 | 0.6 | 0.3 | 0.4 | ||
| Previous years | |||||||||||||||||||
| All previous years | 0.3 | 0.3 | 0.3 | 0.7 | 0.4 | 0.4 | 0.5 | 0.6 | 0.3 | 0.3 | 0.3 | 0.3 | 0.3 | 0.5 | 0.5 | 0.3 | 0.4 | ||
| Previous 30 years | 0.3 | 0.3 | 0.3 | 0.7 | 0.4 | 0.4 | 0.5 | 0.6 | 0.3 | 0.3 | 0.3 | 0.3 | 0.3 | 0.5 | 0.5 | 0.3 | 0.4 | ||
| Previous 20 years | 0.3 | 0.4 | 0.4 | 0.8 | 0.5 | 0.5 | 0.6 | 0.7 | 0.4 | 0.3 | 0.3 | 0.3 | 0.3 | 0.6 | 0.6 | 0.3 | 0.5 | ||
| 10 year groups | |||||||||||||||||||
| [2007,2017) | 0.4 | 0.5 | 0.4 | 0.7 | 0.6 | 0.5 | 0.6 | 0.8 | 0.4 | 0.3 | 0.4 | 0.3 | 0.4 | 0.6 | 0.6 | 0.4 | 0.5 | ||
| [1997,2007) | 0.1 | 0.2 | 0.3 | 0.9 | 0.3 | 0.4 | 0.4 | 0.4 | 0.3 | 0.2 | 0.2 | 0.2 | 0.2 | 0.5 | 0.4 | 0.2 | 0.3 | ||
| [1987,1997) | 0.2 | 0.2 | 0.1 | 0.2 | 0.1 | 0.2 | 0.3 | 0.2 | 0.1 | 0.3 | 0.2 | 0.2 | 0.2 | 0.1 | 0.2 | 0.2 | 0.2 | ||
| 5 year groups | |||||||||||||||||||
| [2012,2017) | 0.4 | 0.5 | 0.4 | 0.6 | 0.6 | 0.5 | 0.7 | 0.9 | 0.5 | 0.4 | 0.5 | 0.4 | 0.4 | 0.5 | 0.7 | 0.4 | 0.5 | ||
| [2007,2012) | 0.3 | 0.3 | 0.4 | 0.8 | 0.7 | 0.6 | 0.5 | 0.3 | 0.2 | 0.1 | 0.3 | 0.2 | 0.3 | 0.7 | 0.5 | 0.2 | 0.5 | ||
| [2002,2007) | 0.1 | 0.2 | 0.3 | 0.6 | 0.3 | 0.4 | 0.4 | 0.4 | 0.3 | 0.2 | 0.2 | 0.2 | 0.2 | 0.4 | 0.4 | 0.3 | 0.3 | ||
| [1997,2002) | 0.1 | 0.2 | 0.3 | 1.3 | 0.3 | 0.4 | 0.3 | 0.4 | 0.2 | 0.1 | 0.1 | 0.1 | 0.1 | 0.6 | 0.4 | 0.1 | 0.3 | ||
| [1992,1997) | 0.3 | 0.2 | 0.0 | 0.3 | 0.2 | 0.2 | 0.5 | 0.1 | 0.3 | 0.3 | 0.4 | 0.1 | 0.2 | 0.2 | 0.3 | 0.3 | 0.2 | ||
| [1987,1992) | 0.1 | 0.2 | 0.1 | 0.2 | 0.1 | 0.2 | 0.1 | 0.3 | 0.1 | 0.2 | 0.1 | 0.3 | 0.2 | 0.1 | 0.2 | 0.1 | 0.2 | ||
| Year | |||||||||||||||||||
| 2017 | 0.4 | 0.5 | 0.4 | 0.6 | 0.6 | 0.6 | 0.9 | 1.0 | 0.5 | 0.4 | 0.3 | 0.6 | 0.5 | 0.5 | 0.8 | 0.4 | 0.6 | ||
| 2016 | 0.4 | 0.6 | 0.5 | 0.8 | 0.9 | 0.8 | 1.1 | 1.0 | 0.6 | 0.4 | 0.4 | 0.5 | 0.5 | 0.7 | 1.0 | 0.5 | 0.7 | ||
| 2015 | 0.8 | 0.9 | 0.7 | 0.7 | 0.5 | 0.6 | 0.7 | 0.9 | 0.6 | 0.4 | 0.7 | 0.5 | 0.7 | 0.6 | 0.7 | 0.6 | 0.7 | ||
| 2014 | 0.2 | 0.3 | 0.2 | 0.5 | 0.3 | 0.5 | 0.5 | 1.1 | 0.7 | 0.5 | 0.6 | 0.5 | 0.4 | 0.4 | 0.7 | 0.6 | 0.5 | ||
| 2013 | 0.1 | 0.2 | 0.2 | 0.7 | 0.2 | 0.2 | 0.4 | 0.4 | 0.1 | 0.3 | 0.3 | 0.2 | 0.2 | 0.4 | 0.3 | 0.2 | 0.3 | ||
| 2012 | 0.1 | 0.2 | 0.1 | 0.4 | 0.4 | 0.2 | 0.2 | 0.3 | 0.1 | 0.3 | 0.2 | 0.1 | 0.1 | 0.3 | 0.2 | 0.2 | 0.2 | ||
| 2011 | 0.9 | 0.6 | 0.3 | 0.8 | 0.5 | 0.1 | 0.4 | 0.3 | 0.1 | 0.1 | 0.1 | 0.1 | 0.4 | 0.6 | 0.3 | 0.1 | 0.3 | ||
| 2010 | 0.1 | 0.1 | 0.3 | 0.8 | 0.6 | 0.6 | 0.5 | 0.5 | 0.3 | 0.1 | 0.3 | 0.5 | 0.3 | 0.6 | 0.5 | 0.2 | 0.5 | ||
| 2009 | 0.2 | 0.5 | 0.6 | 0.7 | 0.3 | 0.6 | 0.7 | 0.3 | 0.1 | 0.2 | 0.5 | 0.1 | 0.2 | 0.6 | 0.5 | 0.3 | 0.4 | ||
| 2008 | 0.1 | 0.2 | 0.4 | 0.8 | 0.8 | 0.7 | 0.7 | 0.3 | 0.1 | 0.2 | 0.7 | 0.2 | 0.2 | 0.7 | 0.6 | 0.3 | 0.5 | ||
| 2007 | 0.4 | 0.2 | 0.5 | 1.2 | 1.7 | 1.1 | 0.6 | 0.4 | 0.1 | 0.1 | 0.3 | 0.2 | 0.2 | 1.1 | 0.8 | 0.1 | 0.6 | ||
| 2006 | 0.2 | 0.2 | 0.3 | 1.4 | 0.6 | 0.6 | 1.2 | 1.0 | 0.9 | 0.7 | 0.1 | 0.3 | 0.2 | 0.9 | 0.9 | 0.7 | 0.7 | ||
| 2005 | 0.1 | 0.2 | 0.2 | 0.2 | 0.5 | 0.4 | 0.2 | 0.3 | 0.1 | 0.3 | 0.5 | 0.5 | 0.3 | 0.3 | 0.3 | 0.3 | 0.3 | ||
| 2004 | 0.0 | 0.0 | 0.3 | 0.5 | 0.1 | 0.2 | 0.3 | 0.3 | 0.3 | 0.1 | 0.1 | 0.1 | 0.0 | 0.3 | 0.3 | 0.1 | 0.2 | ||
| 2003 | 0.0 | 0.3 | 0.3 | 0.1 | 0.2 | 0.5 | 0.1 | 0.2 | 0.0 | 0.0 | 0.0 | 0.1 | 0.2 | 0.2 | 0.3 | 0.0 | 0.2 | ||
| 2002 | 0.2 | 0.2 | 0.5 | 0.2 | 0.1 | 0.2 | 0.2 | 0.2 | 0.1 | 0.0 | 0.1 | 0.1 | 0.2 | 0.3 | 0.2 | 0.1 | 0.2 | ||
| 2001 | 0.1 | 0.2 | 0.4 | 0.3 | 0.2 | 0.5 | 0.5 | 0.5 | 0.1 | 0.2 | 0.2 | 0.1 | 0.1 | 0.3 | 0.5 | 0.2 | 0.3 | ||
| 2000 | 0.1 | 0.2 | 0.3 | 0.6 | 0.3 | 0.2 | 0.3 | 0.2 | 0.2 | 0.0 | 0.0 | 0.2 | 0.2 | 0.4 | 0.2 | 0.1 | 0.2 | ||
| 1999 | 0.0 | 0.4 | 0.4 | 0.3 | 0.3 | 0.6 | 0.2 | 0.3 | 0.2 | 0.1 | 0.1 | 0.1 | 0.2 | 0.3 | 0.4 | 0.1 | 0.3 | ||
| 1998 | 0.3 | 0.1 | 0.3 | 8.4 | 0.2 | 0.6 | 0.4 | 0.0 | 0.2 | 0.1 | 0.0 | 0.0 | 0.1 | 2.5 | 0.4 | 0.2 | 1.1 | ||
| 1997 | 0.1 | 0.1 | 0.1 | 0.2 | 0.2 | 0.2 | 0.1 | 1.7 | 0.0 | 0.1 | 0.2 | 0.1 | 0.1 | 0.1 | 0.6 | 0.1 | 0.2 | ||
| 1996 | 0.1 | 0.1 | 0.1 | 0.2 | 0.1 | 0.1 | 0.2 | 0.0 | 0.0 | 0.2 | 0.7 | 0.3 | 0.2 | 0.1 | 0.1 | 0.2 | 0.2 | ||
| 1995 | 0.2 | 0.0 | 0.0 | 0.5 | 0.0 | 0.0 | 1.0 | 0.1 | 0.5 | 0.4 | 0.1 | 0.0 | 0.1 | 0.2 | 0.5 | 0.4 | 0.3 | ||
| 1994 | 0.3 | 0.5 | 0.1 | 0.5 | 0.2 | 0.1 | 0.5 | 0.2 | 0.2 | 0.1 | 0.1 | 0.2 | 0.3 | 0.2 | 0.3 | 0.1 | 0.2 | ||
| 1993 | 0.1 | 0.1 | 0.0 | 0.2 | 0.6 | 0.7 | 0.2 | 0.4 | 0.5 | 0.9 | 0.6 | 0.1 | 0.1 | 0.3 | 0.4 | 0.6 | 0.4 | ||
| 1992 | 0.6 | 0.5 | 0.0 | 0.1 | 0.0 | 0.1 | 0.0 | 0.0 | 0.0 | 0.2 | 0.8 | 0.1 | 0.4 | 0.0 | 0.0 | 0.3 | 0.2 | ||
| 1991 | 0.3 | 0.1 | 0.2 | 0.2 | 0.0 | 0.0 | 0.5 | 0.2 | 0.1 | 0.0 | 0.1 | 0.1 | 0.2 | 0.1 | 0.2 | 0.1 | 0.2 | ||
| 1990 | 0.1 | 0.1 | 0.0 | 0.0 | 0.0 | 0.0 | 0.2 | 0.0 | 0.0 | 0.0 | 0.0 | 0.1 | 0.1 | 0.0 | 0.1 | 0.0 | 0.1 | ||
| 1989 | 0.1 | 0.5 | 0.1 | 0.3 | 0.1 | 0.4 | 0.1 | 0.8 | 0.1 | 0.7 | 0.1 | 1.0 | 0.5 | 0.2 | 0.4 | 0.3 | 0.3 | ||
| 1988 | 0.1 | 0.1 | 0.1 | 0.1 | 0.1 | 0.1 | 0.1 | 0.1 | 0.1 | 0.1 | 0.1 | 0.1 | 0.1 | 0.1 | 0.1 | 0.1 | 0.1 | ||
| 1987 | 0.0 | 0.0 | 0.1 | 0.1 | 0.1 | 0.1 | 0.1 | 0.1 | 0.1 | 0.1 | 0.1 | 0.1 | 0.1 | 0.1 | 0.1 | 0.1 | 0.1 | ||
| 1986 | 0.0 | 0.0 | 0.0 | 0.0 | 0.0 | 0.4 | 0.0 | 0.0 | 0.0 | 0.0 | 0.0 | 0.0 | 0.0 | 0.0 | 0.2 | 0.0 | 0.0 | ||
| 1985 | 0.0 | 0.0 | 0.0 | 0.0 | 0.0 | 0.0 | 0.0 | 0.1 | 0.0 | 0.0 | 0.0 | 0.1 | 0.0 | 0.0 | 0.0 | 0.0 | 0.0 | ||
| 1984 | 0.0 | 0.0 | 0.0 | 0.0 | 0.0 | 0.0 | 0.0 | 0.0 | 0.0 | 0.0 | 0.0 | 0.0 | 0.0 | 0.0 | 0.0 | 0.0 | 0.0 | ||
| 1983 | 0.0 | 0.0 | 0.0 | 0.0 | 0.0 | 0.0 | 0.0 | 0.0 | 0.0 | - | 0.0 | 0.0 | 0.0 | 0.0 | 0.0 | 0.0 | 0.0 | ||
| 1982 | - | 0.0 | - | 0.0 | 0.0 | 0.0 | - | 0.0 | - | 0.0 | - | 0.0 | 0.0 | 0.0 | 0.0 | 0.0 | 0.0 | ||
Reporting rates
Reporting rate is the proportion of all surveys in which the species was present.
Reporting rate by year
This chart shows the reporting rate of Common Myna each year between 1982 and 2017. 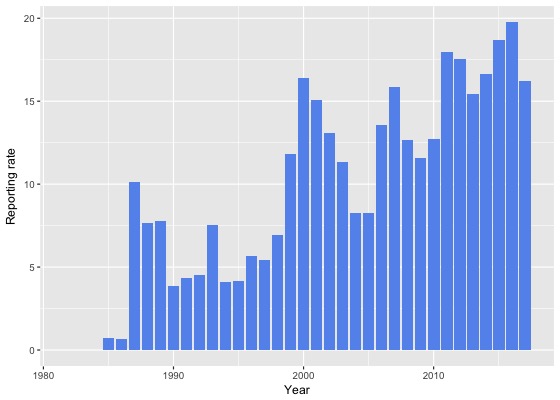
Reporting rate by month
This chart shows the reporting rate by month of Common Myna. The blue lines show the reporting rate for the twelve months to June 2017 and the bars show the average reporting rate for the period 1982 to 2017. 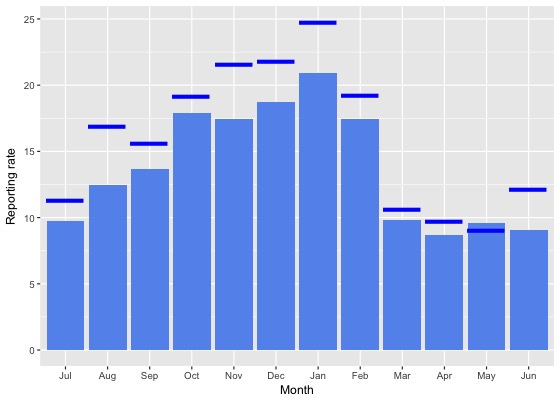
Reporting rate by season
This chart shows the seasonal reporting rate of Common Myna. The blue lines show the seasonal reporting rate for the twelve months to June 2017 and the bars show the average seasonal reporting rate for the period 1982 to 2017. 
Reporting rate data
| Month | Season | ||||||||||||||||||
|---|---|---|---|---|---|---|---|---|---|---|---|---|---|---|---|---|---|---|---|
| Period | Jul | Aug | Sep | Oct | Nov | Dec | Jan | Feb | Mar | Apr | May | Jun | Winter | Spring | Summer | Autumn | All | ||
| All years | |||||||||||||||||||
| All | 9.7 | 12.4 | 13.7 | 17.9 | 17.4 | 18.7 | 20.9 | 17.5 | 9.8 | 8.7 | 9.6 | 9.1 | 10.3 | 16.5 | 19.2 | 9.4 | 14.1 | ||
| Previous years | |||||||||||||||||||
| All previous years | 9.5 | 11.6 | 13.4 | 17.7 | 16.8 | 18.2 | 20.2 | 17.1 | 9.7 | 8.5 | 9.7 | 8.5 | 9.7 | 16.1 | 18.6 | 9.3 | 13.8 | ||
| Previous 30 years | 9.6 | 11.8 | 13.6 | 18.0 | 17.1 | 18.6 | 20.4 | 17.4 | 9.8 | 8.7 | 9.9 | 8.6 | 9.9 | 16.4 | 18.9 | 9.4 | 14.0 | ||
| Previous 20 years | 10.5 | 13.7 | 15.1 | 19.7 | 20.4 | 20.5 | 22.5 | 19.5 | 10.4 | 9.1 | 10.9 | 9.2 | 10.8 | 18.4 | 20.9 | 10.1 | 15.5 | ||
| 10 year groups | |||||||||||||||||||
| [2007,2017) | 12.7 | 15.3 | 15.5 | 20.3 | 24.0 | 22.4 | 24.3 | 22.2 | 11.9 | 9.7 | 12.0 | 9.8 | 12.2 | 19.7 | 23.1 | 11.1 | 17.1 | ||
| [1997,2007) | 6.7 | 10.1 | 14.3 | 17.6 | 13.2 | 16.7 | 16.7 | 12.3 | 7.4 | 7.5 | 8.3 | 7.9 | 8.1 | 15.1 | 15.5 | 7.6 | 11.8 | ||
| [1987,1997) | 6.4 | 6.2 | 6.0 | 8.1 | 6.1 | 7.9 | 7.9 | 7.4 | 6.1 | 6.5 | 5.8 | 5.8 | 6.1 | 6.8 | 7.8 | 6.1 | 6.7 | ||
| 5 year groups | |||||||||||||||||||
| [2012,2017) | 14.0 | 16.8 | 16.6 | 20.4 | 25.5 | 23.9 | 24.9 | 23.5 | 13.3 | 11.5 | 11.9 | 10.1 | 13.3 | 20.6 | 24.2 | 12.3 | 18.2 | ||
| [2007,2012) | 9.1 | 10.0 | 12.9 | 20.0 | 19.9 | 19.2 | 22.1 | 16.7 | 7.8 | 5.7 | 12.4 | 9.4 | 9.5 | 18.0 | 19.7 | 8.0 | 14.4 | ||
| [2002,2007) | 5.9 | 7.6 | 13.6 | 17.3 | 12.6 | 17.7 | 15.8 | 11.8 | 6.3 | 6.4 | 5.8 | 6.6 | 6.6 | 14.7 | 15.7 | 6.2 | 11.0 | ||
| [1997,2002) | 8.1 | 13.1 | 15.1 | 18.2 | 13.9 | 15.3 | 17.8 | 12.7 | 8.9 | 8.8 | 11.3 | 9.6 | 10.2 | 15.7 | 15.3 | 9.5 | 12.9 | ||
| [1992,1997) | 5.2 | 3.9 | 2.3 | 7.1 | 6.1 | 5.3 | 6.1 | 5.0 | 4.1 | 5.9 | 5.7 | 3.0 | 4.0 | 5.4 | 5.5 | 5.2 | 5.1 | ||
| [1987,1992) | 6.9 | 7.4 | 7.7 | 8.6 | 6.0 | 9.1 | 8.9 | 8.4 | 7.3 | 6.8 | 5.9 | 7.4 | 7.3 | 7.4 | 8.8 | 6.7 | 7.5 | ||
| Year | |||||||||||||||||||
| 2017 | 11.3 | 16.9 | 15.6 | 19.1 | 21.6 | 21.8 | 24.7 | 19.3 | 10.6 | 9.7 | 9.0 | 12.2 | 13.5 | 18.8 | 22.1 | 9.8 | 16.2 | ||
| 2016 | 12.2 | 15.0 | 15.8 | 24.8 | 32.6 | 28.4 | 31.6 | 23.7 | 15.9 | 11.0 | 10.3 | 10.5 | 12.7 | 23.9 | 27.9 | 12.6 | 19.7 | ||
| 2015 | 19.3 | 22.8 | 20.3 | 21.3 | 23.4 | 23.8 | 20.9 | 23.0 | 12.7 | 11.0 | 14.2 | 12.5 | 17.2 | 21.6 | 22.4 | 12.5 | 18.7 | ||
| 2014 | 9.7 | 9.7 | 15.3 | 17.0 | 17.0 | 19.1 | 21.7 | 25.4 | 15.4 | 12.5 | 12.5 | 12.5 | 11.1 | 16.5 | 22.3 | 13.8 | 16.6 | ||
| 2013 | 4.1 | 11.3 | 12.5 | 13.3 | 16.9 | 21.6 | 27.1 | 24.6 | 9.1 | 14.4 | 10.9 | 5.4 | 6.8 | 14.1 | 24.3 | 11.4 | 15.4 | ||
| 2012 | 20.9 | 23.2 | 17.6 | 20.6 | 29.5 | 21.0 | 18.7 | 19.0 | 8.6 | 9.4 | 12.8 | 4.5 | 15.1 | 21.9 | 19.5 | 9.8 | 17.6 | ||
| 2011 | 18.7 | 15.2 | 10.5 | 21.2 | 12.7 | 23.8 | 26.6 | 27.4 | 14.4 | 8.2 | 17.1 | 15.1 | 15.9 | 16.7 | 25.8 | 13.0 | 18.0 | ||
| 2010 | 5.2 | 6.1 | 10.9 | 18.9 | 15.8 | 16.0 | 20.8 | 16.5 | 7.5 | 4.3 | 8.8 | 9.5 | 7.8 | 16.0 | 17.8 | 6.4 | 12.7 | ||
| 2009 | 6.5 | 15.6 | 15.4 | 17.3 | 15.2 | 15.3 | 17.3 | 8.3 | 2.8 | 4.1 | 6.1 | 5.4 | 7.9 | 16.4 | 14.2 | 4.1 | 11.6 | ||
| 2008 | 4.8 | 7.8 | 10.5 | 19.8 | 26.2 | 18.5 | 22.2 | 10.2 | 4.8 | 4.0 | 9.0 | 6.1 | 6.1 | 18.2 | 17.5 | 5.2 | 12.7 | ||
| 2007 | 11.0 | 5.6 | 17.8 | 23.3 | 34.5 | 20.1 | 20.1 | 11.3 | 6.0 | 7.7 | 14.6 | 8.1 | 8.1 | 23.7 | 18.6 | 8.4 | 15.9 | ||
| 2006 | 5.3 | 7.8 | 13.7 | 22.3 | 14.3 | 16.8 | 24.2 | 24.4 | 7.3 | 8.1 | 2.2 | 10.0 | 8.1 | 18.1 | 21.5 | 6.5 | 13.5 | ||
| 2005 | 3.7 | 6.5 | 7.8 | 8.8 | 12.4 | 13.9 | 8.5 | 8.7 | 5.6 | 10.9 | 7.5 | 4.2 | 4.6 | 9.2 | 11.4 | 7.8 | 8.2 | ||
| 2004 | 5.2 | 3.3 | 12.0 | 19.2 | 8.1 | 13.4 | 11.5 | 8.1 | 6.2 | 3.3 | 1.9 | 3.7 | 4.2 | 13.0 | 11.6 | 4.2 | 8.3 | ||
| 2003 | 5.1 | 10.1 | 15.3 | 15.5 | 13.8 | 23.7 | 16.3 | 7.7 | 4.5 | 4.6 | 6.2 | 7.5 | 7.7 | 14.8 | 16.6 | 4.9 | 11.3 | ||
| 2002 | 9.7 | 11.0 | 20.9 | 15.5 | 14.0 | 19.5 | 17.0 | 9.9 | 7.3 | 5.4 | 11.8 | 7.0 | 9.0 | 16.7 | 16.6 | 7.4 | 13.1 | ||
| 2001 | 8.4 | 13.3 | 17.8 | 22.7 | 19.3 | 21.0 | 22.0 | 13.4 | 8.4 | 13.2 | 9.8 | 10.3 | 10.4 | 19.7 | 19.1 | 10.1 | 15.0 | ||
| 2000 | 13.5 | 20.9 | 22.3 | 23.3 | 19.9 | 14.7 | 21.9 | 13.3 | 11.0 | 9.3 | 10.9 | 13.4 | 15.9 | 21.9 | 16.6 | 10.3 | 16.4 | ||
| 1999 | 0.0 | 8.2 | 13.8 | 13.2 | 9.7 | 17.5 | 10.9 | 13.6 | 11.4 | 7.7 | 14.8 | 10.7 | 9.0 | 12.3 | 14.2 | 11.2 | 11.8 | ||
| 1998 | 5.4 | 5.7 | 8.1 | 9.8 | 8.8 | 5.7 | 13.2 | 3.8 | 4.3 | 5.1 | 7.4 | 2.7 | 4.2 | 8.8 | 7.5 | 5.0 | 6.9 | ||
| 1997 | 3.4 | 6.9 | 2.7 | 9.2 | 5.1 | 8.7 | 5.9 | 14.0 | 0.0 | 2.8 | 6.7 | 1.4 | 3.7 | 5.3 | 9.4 | 3.1 | 5.4 | ||
| 1996 | 4.5 | 2.1 | 5.3 | 7.9 | 5.6 | 6.1 | 8.7 | 1.2 | 2.9 | 7.8 | 12.1 | 5.7 | 4.0 | 6.4 | 5.6 | 6.7 | 5.7 | ||
| 1995 | 4.3 | 2.3 | 1.9 | 7.3 | 2.7 | 3.4 | 5.3 | 6.3 | 6.1 | 4.8 | 1.3 | 2.1 | 2.8 | 4.5 | 4.9 | 4.3 | 4.1 | ||
| 1994 | 7.8 | 6.5 | 2.9 | 5.8 | 4.4 | 4.3 | 2.9 | 8.6 | 1.1 | 4.6 | 1.2 | 1.1 | 4.6 | 4.5 | 5.2 | 2.7 | 4.1 | ||
| 1993 | 2.0 | 3.8 | 1.6 | 6.7 | 21.2 | 8.7 | 8.2 | 12.5 | 7.4 | 8.3 | 7.8 | 4.3 | 3.6 | 9.9 | 9.4 | 7.8 | 7.5 | ||
| 1992 | 7.7 | 7.4 | 0.0 | 7.4 | 1.4 | 4.8 | 5.2 | 0.0 | 2.8 | 6.8 | 7.9 | 1.7 | 5.6 | 3.2 | 3.7 | 5.8 | 4.5 | ||
| 1991 | 5.5 | 3.2 | 5.8 | 5.8 | 2.1 | 4.1 | 1.8 | 6.0 | 4.8 | 1.7 | 4.9 | 6.0 | 4.8 | 4.5 | 3.9 | 3.8 | 4.3 | ||
| 1990 | 5.8 | 6.5 | 0.0 | 0.0 | 0.9 | 4.2 | 11.1 | 5.6 | 3.4 | 1.2 | 0.0 | 5.3 | 6.0 | 0.3 | 7.0 | 1.6 | 3.8 | ||
| 1989 | 7.7 | 10.8 | 5.7 | 8.8 | 6.1 | 8.3 | 5.3 | 9.3 | 6.1 | 7.7 | 6.6 | 10.1 | 9.6 | 7.0 | 7.7 | 6.8 | 7.8 | ||
| 1988 | 8.2 | 7.1 | 10.7 | 8.2 | 5.2 | 8.2 | 9.5 | 8.0 | 7.4 | 8.6 | 6.6 | 5.8 | 7.1 | 7.6 | 8.6 | 7.5 | 7.7 | ||
| 1987 | 0.0 | 0.0 | 10.9 | 13.3 | 9.6 | 14.2 | 12.8 | 9.2 | 10.5 | 7.8 | 7.0 | 7.8 | 7.0 | 11.1 | 11.9 | 8.4 | 10.1 | ||
| 1986 | 3.8 | 0.0 | 0.0 | 0.0 | 0.0 | 2.9 | 0.0 | 2.8 | 0.0 | 0.0 | 0.0 | 0.0 | 1.0 | 0.0 | 2.2 | 0.0 | 0.7 | ||
| 1985 | 0.0 | 0.0 | 0.0 | 0.0 | 0.0 | 0.0 | 0.0 | 11.8 | 0.0 | 0.0 | 0.0 | 3.6 | 1.1 | 0.0 | 2.4 | 0.0 | 0.7 | ||
| 1984 | 0.0 | 0.0 | 0.0 | 0.0 | 0.0 | 0.0 | 0.0 | 0.0 | 0.0 | 0.0 | 0.0 | 0.0 | 0.0 | 0.0 | 0.0 | 0.0 | 0.0 | ||
| 1983 | 0.0 | 0.0 | 0.0 | 0.0 | 0.0 | 0.0 | 0.0 | 0.0 | 0.0 | - | 0.0 | 0.0 | 0.0 | 0.0 | 0.0 | 0.0 | 0.0 | ||
| 1982 | - | 0.0 | - | 0.0 | 0.0 | 0.0 | - | 0.0 | - | 0.0 | - | 0.0 | 0.0 | 0.0 | 0.0 | 0.0 | 0.0 | ||
Breeding data
Breeding records by month
Number of breeding records by breeding code and month, 2017 and all years| Breeding code | Jul | Aug | Sep | Oct | Nov | Dec | Jan | Feb | Mar | Apr | May | Jun |
|---|---|---|---|---|---|---|---|---|---|---|---|---|
| 2017 | ||||||||||||
| Breeding (BLA code) | 0 | 0 | 0 | 0 | 1 | 0 | 0 | 0 | 0 | 0 | 0 | 0 |
| Carrying Food | 0 | 0 | 0 | 3 | 2 | 9 | 8 | 0 | 0 | 0 | 0 | 0 |
| Copulating | 0 | 0 | 0 | 0 | 0 | 0 | 0 | 0 | 0 | 0 | 0 | 0 |
| Display | 0 | 0 | 0 | 0 | 0 | 0 | 0 | 0 | 0 | 0 | 0 | 0 |
| Dependent young | 0 | 0 | 0 | 0 | 1 | 9 | 27 | 9 | 2 | 0 | 0 | 0 |
| Faecal sac | 0 | 0 | 0 | 0 | 0 | 0 | 0 | 0 | 0 | 0 | 0 | 0 |
| Inspecting hollow | 0 | 0 | 0 | 6 | 1 | 0 | 0 | 0 | 0 | 0 | 0 | 0 |
| Nest building | 0 | 0 | 1 | 1 | 2 | 0 | 0 | 0 | 0 | 0 | 0 | 0 |
| Nest with eggs | 0 | 0 | 0 | 0 | 0 | 0 | 0 | 0 | 0 | 0 | 0 | 0 |
| Nest with young | 0 | 0 | 0 | 0 | 3 | 3 | 0 | 0 | 0 | 0 | 0 | 0 |
| On/leaving nest | 0 | 3 | 2 | 5 | 7 | 8 | 7 | 2 | 0 | 0 | 0 | 0 |
| All years | ||||||||||||
| Breeding (BLA code) | 0 | 0 | 0 | 3 | 4 | 1 | 3 | 0 | 0 | 0 | 0 | 0 |
| Carrying Food | 0 | 0 | 1 | 17 | 11 | 20 | 15 | 4 | 0 | 0 | 0 | 0 |
| Copulating | 0 | 0 | 0 | 0 | 0 | 0 | 0 | 0 | 0 | 0 | 0 | 0 |
| Display | 0 | 0 | 0 | 0 | 0 | 0 | 0 | 0 | 0 | 0 | 0 | 0 |
| Dependent young | 0 | 0 | 0 | 4 | 4 | 23 | 32 | 17 | 2 | 0 | 0 | 0 |
| Faecal sac | 0 | 0 | 0 | 0 | 0 | 0 | 0 | 0 | 0 | 0 | 0 | 0 |
| Inspecting hollow | 2 | 3 | 10 | 41 | 7 | 11 | 3 | 1 | 1 | 0 | 0 | 1 |
| Nest building | 0 | 1 | 6 | 14 | 9 | 3 | 2 | 0 | 0 | 1 | 0 | 0 |
| Nest with eggs | 0 | 0 | 0 | 0 | 1 | 0 | 0 | 0 | 0 | 0 | 0 | 0 |
| Nest with young | 0 | 0 | 0 | 6 | 18 | 12 | 3 | 3 | 1 | 0 | 0 | 0 |
| On/leaving nest | 0 | 3 | 10 | 34 | 18 | 27 | 11 | 6 | 0 | 0 | 0 | 0 |
Breeding records by year
Average number of breeding records per period by breeding code| Period | Breeding (BLA code) | Carrying Food | Copulating | Display | Dependent young | Faecal sac | Inspecting hollow | Nest building | Nest with eggs | Nest with young | On/leaving nest |
|---|---|---|---|---|---|---|---|---|---|---|---|
| All years | |||||||||||
| All | 0.3 | 1.9 | 0.0 | 0.0 | 2.3 | 0.0 | 2.2 | 1.0 | 0.0 | 1.2 | 3.0 |
| Previous years | |||||||||||
| All previous years | 0.3 | 1.3 | 0.0 | 0.0 | 1.0 | 0.0 | 2.1 | 0.9 | 0.0 | 1.1 | 2.1 |
| Previous 30 years | 0.3 | 1.5 | 0.0 | 0.0 | 1.1 | 0.0 | 2.4 | 1.1 | 0.0 | 1.2 | 2.5 |
| Previous 20 years | 0.5 | 1.8 | 0.0 | 0.0 | 1.0 | 0.0 | 3.5 | 0.8 | 0.0 | 1.2 | 3.7 |
| 10 year groups | |||||||||||
| [2007,2017) | 0.3 | 3.1 | 0.0 | 0.0 | 1.0 | 0.0 | 4.2 | 1.1 | 0.0 | 1.5 | 5.5 |
| [1997,2007) | 0.7 | 0.5 | 0.0 | 0.0 | 1.0 | 0.0 | 2.8 | 0.5 | 0.0 | 1.0 | 1.9 |
| [1987,1997) | 0.0 | 1.0 | 0.0 | 0.0 | 1.4 | 0.0 | 0.3 | 1.6 | 0.1 | 1.2 | 0.1 |
| 5 year groups | |||||||||||
| [2012,2017) | 0.2 | 3.4 | 0.0 | 0.0 | 1.0 | 0.0 | 3.6 | 1.2 | 0.0 | 1.4 | 5.0 |
| [2007,2012) | 0.4 | 2.8 | 0.0 | 0.0 | 1.0 | 0.0 | 4.8 | 1.0 | 0.0 | 1.6 | 6.0 |
| [2002,2007) | 0.6 | 0.4 | 0.0 | 0.0 | 1.4 | 0.0 | 2.8 | 0.6 | 0.0 | 1.4 | 1.0 |
| [1997,2002) | 0.8 | 0.6 | 0.0 | 0.0 | 0.6 | 0.0 | 2.8 | 0.4 | 0.0 | 0.6 | 2.8 |
| [1992,1997) | 0.0 | 0.2 | 0.0 | 0.0 | 0.2 | 0.0 | 0.4 | 0.2 | 0.0 | 0.2 | 0.2 |
| [1987,1992) | 0.0 | 1.8 | 0.0 | 0.0 | 2.6 | 0.0 | 0.2 | 3.0 | 0.2 | 2.2 | 0.0 |
| Year | |||||||||||
| 2017 | 1.0 | 22.0 | 0.0 | 0.0 | 48.0 | 0.0 | 7.0 | 4.0 | 0.0 | 6.0 | 34.0 |
| 2016 | 0.0 | 9.0 | 0.0 | 0.0 | 2.0 | 0.0 | 8.0 | 1.0 | 0.0 | 1.0 | 8.0 |
| 2015 | 0.0 | 4.0 | 0.0 | 0.0 | 2.0 | 0.0 | 5.0 | 0.0 | 0.0 | 4.0 | 9.0 |
| 2014 | 0.0 | 1.0 | 0.0 | 0.0 | 1.0 | 0.0 | 2.0 | 3.0 | 0.0 | 0.0 | 2.0 |
| 2013 | 1.0 | 3.0 | 0.0 | 0.0 | 0.0 | 0.0 | 1.0 | 1.0 | 0.0 | 2.0 | 3.0 |
| 2012 | 0.0 | 0.0 | 0.0 | 0.0 | 0.0 | 0.0 | 2.0 | 1.0 | 0.0 | 0.0 | 3.0 |
| 2011 | 1.0 | 6.0 | 0.0 | 0.0 | 1.0 | 0.0 | 6.0 | 0.0 | 0.0 | 1.0 | 4.0 |
| 2010 | 1.0 | 5.0 | 0.0 | 0.0 | 0.0 | 0.0 | 6.0 | 2.0 | 0.0 | 0.0 | 4.0 |
| 2009 | 0.0 | 1.0 | 0.0 | 0.0 | 2.0 | 0.0 | 4.0 | 1.0 | 0.0 | 1.0 | 12.0 |
| 2008 | 0.0 | 2.0 | 0.0 | 0.0 | 2.0 | 0.0 | 5.0 | 1.0 | 0.0 | 3.0 | 8.0 |
| 2007 | 0.0 | 0.0 | 0.0 | 0.0 | 0.0 | 0.0 | 3.0 | 1.0 | 0.0 | 3.0 | 2.0 |
| 2006 | 2.0 | 2.0 | 0.0 | 0.0 | 2.0 | 0.0 | 4.0 | 0.0 | 0.0 | 4.0 | 1.0 |
| 2005 | 0.0 | 0.0 | 0.0 | 0.0 | 3.0 | 0.0 | 1.0 | 2.0 | 0.0 | 2.0 | 3.0 |
| 2004 | 0.0 | 0.0 | 0.0 | 0.0 | 1.0 | 0.0 | 3.0 | 0.0 | 0.0 | 0.0 | 0.0 |
| 2003 | 0.0 | 0.0 | 0.0 | 0.0 | 0.0 | 0.0 | 1.0 | 0.0 | 0.0 | 0.0 | 0.0 |
| 2002 | 1.0 | 0.0 | 0.0 | 0.0 | 1.0 | 0.0 | 5.0 | 1.0 | 0.0 | 1.0 | 1.0 |
| 2001 | 3.0 | 2.0 | 0.0 | 0.0 | 1.0 | 0.0 | 6.0 | 0.0 | 0.0 | 1.0 | 11.0 |
| 2000 | 1.0 | 0.0 | 0.0 | 0.0 | 0.0 | 0.0 | 5.0 | 0.0 | 0.0 | 2.0 | 0.0 |
| 1999 | 0.0 | 0.0 | 0.0 | 0.0 | 2.0 | 0.0 | 0.0 | 2.0 | 0.0 | 0.0 | 1.0 |
| 1998 | 0.0 | 1.0 | 0.0 | 0.0 | 0.0 | 0.0 | 2.0 | 0.0 | 0.0 | 0.0 | 1.0 |
| 1997 | 0.0 | 0.0 | 0.0 | 0.0 | 0.0 | 0.0 | 1.0 | 0.0 | 0.0 | 0.0 | 1.0 |
| 1996 | 0.0 | 0.0 | 0.0 | 0.0 | 0.0 | 0.0 | 1.0 | 0.0 | 0.0 | 0.0 | 0.0 |
| 1995 | 0.0 | 0.0 | 0.0 | 0.0 | 0.0 | 0.0 | 0.0 | 0.0 | 0.0 | 0.0 | 0.0 |
| 1994 | 0.0 | 0.0 | 0.0 | 0.0 | 0.0 | 0.0 | 0.0 | 0.0 | 0.0 | 0.0 | 1.0 |
| 1993 | 0.0 | 0.0 | 0.0 | 0.0 | 1.0 | 0.0 | 0.0 | 0.0 | 0.0 | 0.0 | 0.0 |
| 1992 | 0.0 | 1.0 | 0.0 | 0.0 | 0.0 | 0.0 | 1.0 | 1.0 | 0.0 | 1.0 | 0.0 |
| 1991 | 0.0 | 0.0 | 0.0 | 0.0 | 0.0 | 0.0 | 1.0 | 0.0 | 0.0 | 0.0 | 0.0 |
| 1990 | 0.0 | 0.0 | 0.0 | 0.0 | 1.0 | 0.0 | 0.0 | 0.0 | 0.0 | 0.0 | 0.0 |
| 1989 | 0.0 | 6.0 | 0.0 | 0.0 | 7.0 | 0.0 | 0.0 | 7.0 | 0.0 | 1.0 | 0.0 |
| 1988 | 0.0 | 1.0 | 0.0 | 0.0 | 3.0 | 0.0 | 0.0 | 4.0 | 0.0 | 1.0 | 0.0 |
| 1987 | 0.0 | 2.0 | 0.0 | 0.0 | 2.0 | 0.0 | 0.0 | 4.0 | 1.0 | 9.0 | 0.0 |
| 1986 | 0.0 | 0.0 | 0.0 | 0.0 | 0.0 | 0.0 | 0.0 | 0.0 | 0.0 | 0.0 | 0.0 |
| 1985 | 0.0 | 0.0 | 0.0 | 0.0 | 0.0 | 0.0 | 0.0 | 0.0 | 0.0 | 0.0 | 0.0 |
| 1984 | 0.0 | 0.0 | 0.0 | 0.0 | 0.0 | 0.0 | 0.0 | 0.0 | 0.0 | 0.0 | 0.0 |
| 1983 | 0.0 | 0.0 | 0.0 | 0.0 | 0.0 | 0.0 | 0.0 | 0.0 | 0.0 | 0.0 | 0.0 |
| 1982 | 0.0 | 0.0 | 0.0 | 0.0 | 0.0 | 0.0 | 0.0 | 0.0 | 0.0 | 0.0 | 0.0 |
Distribution map
Distribution - 2017
This map shows the observed distribution of the Common Myna for 2017.
The red circles are the grid cells where Common Myna have been reported.
The transparency of the red circles indicate how many surveys sheets were submitted for that grid cell; the darker the red the more reliable the data. Of the 315 grid cells with reports, 83 had only one sheet; an example is grid number M30.
The size of the circle represents the reporting rate. The maximum reporting rate for Common Myna was 100.0% (eg grid number M30) and the minimum was 0.6% (eg grid number I13). 
Distribution - all years
This map shows the observed distribution of the Common Myna for all years.
The red circles are the grid cells where Common Myna have been reported.
The transparency of the red circles indicate how many surveys sheets were submitted for that grid cell; the darker the red the more reliable the data. Of the 703 grid cells with reports, 55 had only one sheet; an example is grid number A12.
The size of the circle represents the reporting rate. The maximum reporting rate for Common Myna was 100.0% (eg grid number Z12) and the minimum was 0.2% (eg grid number F18). 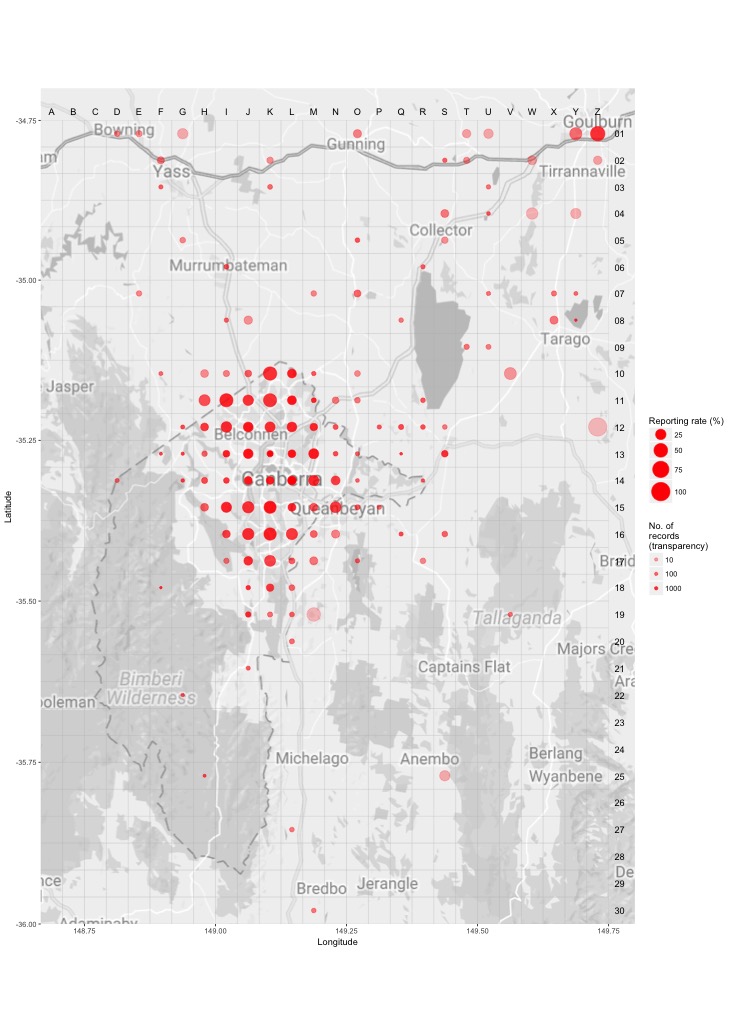
Breeding map
Breeding - 2017
This map shows the breeding distribution of the Common Myna for 2017.
The red circles are the grid cells where breeding activity for Common Myna have been reported.
The size of the circle represents the number of reports. 
Breeding - all years
This map shows the breeding distribution of the Common Myna for all years.
The red circles are the grid cells where breeding activity for Common Myna have been reported.
The size of the circle represents the number of reports. 